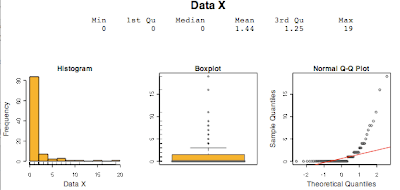
I spent a little time today writing a generic eda function in R. R is way hip but the graphics take a bit of tweaking. My particular problem was that I wanted a small footprint graphic that would give me a good idea of distribution of a univariate data set... that I wouldn't be ashamed of presenting to the executive types. Here is the function:
jayridge.eda<-function(x, title) {
    # This function is based on simple.eda from the book,
    # "Using R for Introdcutory Statistics", by John Verzani
    #
    # I found that the general function was useful but needed
    # better titling and formatting for use in EDA presentations.

    op<-par(no.readonly = TRUE); # save old parameters
    par(mai=c(.6,.5,.2,.2))
    par(family="sans")
    par(cex.lab=1.2)

    # Create a layout with two rows. The first row spans
    # 3 columns.
    #
    #      [,1] [,2] [,3]
    # [1,]    1    1    1
    # [2,]    2    3    4

    layout(matrix(c(1,1,1,2,3,4), ncol=3, byrow=TRUE), heights=c(1,2))

    # Frame 1: print the title, date and
    plot.new()
    plot.window(xlim=c(0,1), ylim=c(0,1))
    title(main=title, cex.main=2)
    f<-as.character(summary(x))
    fStr<-sprintf("%9s %9s %9s %9s %9s %9s\n%9s %9s %9s %9s %9s %9s",
                  "Min","1st Qu","Median","Mean","3rd Qu","Max",
                  f[1],f[2],f[3],f[4],f[5],f[6])
    text(0.5,0.5, labels=fStr, cex=1.4, adj=.5, family="mono")

    # Frame 2: plot a histogram.
    hist(x, main="Histogram", xlab=title, col="orange")
    rug(x)

    # Frame 3: plot a boxplot.
    boxplot(x, varwidth=TRUE, col="orange", border="grey30")
    rug(x,side=2)
    title("Boxplot")

    # Frame 4: plot a normal QQ.
    qqnorm(x, col="grey30")
    qqline(x,col="red")

    par(op); # reset old parameters
}
And here is the fabulous output!